Prysm's remote debugging support is currently a task in active development. The Google Chrome browser is required.
Prysm's DevTools are based on Google Chrome's DevTools. The DevTools actually acts the same way as one may expect form the real Google Chrome browser with remote debugging enabled. Among the many advantages of the chosen approach are the many features, the usability and no need to get used to a new GUI if you already have some experience with debugging in Google Chrome.
Supported Platforms
- Windows
- Android
- UWP [partial]
- Xbox One [partial]
- PlayStation 4 [partial]
- Nintendo Switch [partial]
- Mac OS X [partial]
- iOS [planned]
Refer to the Supported panels below for more info.
Configure Inspector
First make sure to properly configure the application using Cohtml to enable debugging. Configuration is simple - just modify a couple of values in the SystemSettings (see below), for Android some temporary changes to the manifest file are needed. From there on the workflow is the same as every JavaScript developer would expect.
Windows
- During the first time Windows will possibly ask for firewall permission that must be granted for opening requested port
Android
- Give internet access in the manifest file.
- Note
- Make sure this permission is not present in the shipping configurations unless needed by the application.
<uses-permission android:name="android.permission.INTERNET" />
Accessing DevTools
Windows
- Once the application is started if everything is configured correctly Cohtml will listen for HTTP requests on the opened port on the PC. This means that a browser can send requests and the UI debugger is going to handle and respond to them. Make sure the chosen browser is Google Chrome.
- Connect to the PC and port provided in
cohtml::SystemSettings::DebuggerPort from Google Chrome. This could be localhost:port if Google Chrome is ran on the same PC as Cohtml. All available Views are listed upon connection.
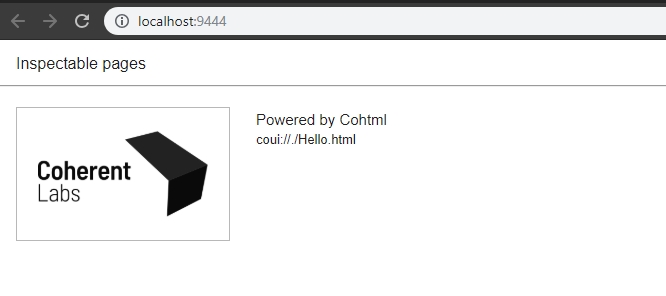
Available views shown in Google Chrome
- Choose the view to debug and proceed with troubleshooting.
UWP (Universal Windows Platform)
Configuring and using the inspector is similar to Windows. However, there is an exception if you want to use the inspector on the same machine at which the application you want to inspect is running.
On UWP you can't normally connect to the inspector from an application on the same machine due to disabled network loopback. Therefore you have to connect from another IP address. However, if you want run the inspector on the same machine you can run C:\Windows\System32\CheckNetIsolation.exe with the following options:
CheckNetIsolation.exe LoopbackExempt -is -n=AppContainer Name or Package Family Name
The Package Family Name can be found by opening the appxmanifest of the UWP app in Visual Studio and selecting the Packaging tab. This command allows the application to receive inbound connections. It should be left running while you are inspecting the application. For example, to enable the inspector for the UWPCohtml sample on the same machine you have to run the following:
CheckNetIsolation.exe LoopbackExempt -is -n=8df7e036-ff94-4ed5-a2d3-2b2933d4cbf5_36aj8sfe8v5jt
After that you can connect to the PC and port provided in cohtml::SystemSettings::DebuggerPort from Google Chrome.
Android
Workflow is similar to Windows with one difference:
- Connection is remote - from the Google Chrome browser running on a PC to the application running on a device.
- In order to debug the application determine its IP address by connecting it to the Wi-Fi and checking the WLAN IP address from Settings (different per device).
- Connect using that IP and the port provided in
cohtml::SystemSettings::DebuggerPort from Google Chrome, instead of localhost.
- Note
- Debugging is remote, rather than through a USB connection, so one is not needed.
Supported panels
- Elements panel
- DOM tree view - view and modify the DOM tree.
- Element styles view (accessed through the Styles sidebar tab) - view of the element's inline and attribute styles.
- Element computed style (accessed through the Computed sidebar tab) - List of all computed styles including rendered fonts information. Styles and font info are refreshed when another element is selected.
- Debugging JavaScript (accessed through the Sources tab). Fully supported on Windows and Android only.
- Console (accessed through the Console tab). Fully supported on Windows and Android only.
- Sources
- The panel is supported on all compatible platforms
- Known issues: When navigating between pages (or dynamically re-loading the same page) while connected with the DevTools, the Sources panel is not updated correctly. Please refresh the browser window with DevTools to see the correct loaded sources.
- Performance profiling (accessed through the Performance tab). Partial support on all supported platforms:
- Recording
- Timeline - see how much time did different components take - this includes:
- Style Recalculations - shows also style match cache misses
- Script Execution
- V8 Tracing Events - shows where V8 is spending time
- Layout
- GPU time.
- Paint
- Match Elements - how much time is spent matching nodes
- Build DOM - how much time is spent building nodes
- Record Rendering - shows also resources cache misses
- Schedule Style Recalculation - has a run-time option for maximum schedules
- Invalidate Layout - has a run-time option for maximum invalidations
- GPU metrics are only supported with DirectX 11
- Initiators
- To specify the number of maximum initiators shown for a single Recalculate Styles and Layout event, the JavaScript function
engine.setInspectorInitatorsUpperBound(count) can be used. By default, there is no upper boundary and all initiators are shown. Based on the profiled UI, showing all the initiators for a given event might affect the performance, but will give more information about the causes for the event and the costs of the JavaScript functions can be analyzed.
- Network activity inspection (accessed through the Network tab). Partial support on all supported platforms:
- Inspecting request-response times, headers, and URLs is supported for all cohtml resources except Fonts.
- Partial media requests are accumulated into a single network panel entry. The time and size for that request are accumulated as well.
- Requests for resources that were cached before are marked as
(memory cached) and contain 304 Status Code and Coherent-Cached header.
- User image responses are marked with the
Coherent-UserImage: true header. User image responses body is never exposed.
- Messages viewer for WebSocket connections is supported with the following limitations:
- request/response headers and statuses are not exposed and hardcoded to the default ones
- binary payload viewer is not supported
- Because in Prysm normal requests have a single state of loading, the time spent for a request falls into the Stalled category, which is expected.
- The time visible in the Network tab for a request is the time from issuing the request on the Main (UI) thread to receiving the response on the Main thread. Hence both main and worker thread tasks scheduling and execution affect the times shown in the network tab.
- Response body inspection is supported for all requests except requests for resources that were cached previously
- e.g. The first request for an image will be shown in Inspector and the response can be viewed for that response. But the next request for the same image won't contain the original response body and headers because no requests were performed.
- By default, the data for Network Panel will be collected only when the Inspector Network Panel is connected to the cohtml server. It means that if you load a page, open the Inspector URL, and open the Network Panel, the requests performed before opening the Network Panel won't be visible. Only subsequent requests will be shown. In order to see the requests performed before opening the Network Panel,
cohtml::ViewSettings can be used. Prysm provides a cohtml::ViewSettings::InspectorNetworkTabMode setting in cohtml::ViewSettings. This setting can be changed to cohtml::InspectorNetworkTabSettings::Mode::AlwaysEnabled, which should lead to the desired behavior: requests data will be collected regardless of the state of the Inspector frontend. Refer to cohtml::InspectorNetworkTabSettings::Mode for more information.
- Note
- Anything not mentioned is not yet supported.
Source maps
Since the inspector loads source maps by itself and doesn't understand the coui:// protocol, the only way to use source maps is if they are embedded. How to do that https://github.com/CoherentLabs/InlineSourceMaps
Further Resources
For more information on DevTools usage consult the documentation here.
